Binet’s ‘Share of Search’ metric - and how we've taken it one step further
Executive summary:
Les Binet, the originator of the ‘Share of Search’ metric, acknowledges the source of inspiration for developing the theory in the fact that ‘many businesses have no clear idea how they are performing against the market’.
Whilst the research behind Share of Search is reliant on Google Trends data, our view is that the use of SimilarWeb data allows any brand (not just brands big enough to appear in trends) to accurately measure their share of market. Along with several other industry tools, this will help create an integrated measurement and performance plan – not something only available to big legacy brands, but growth D2C brands as well.
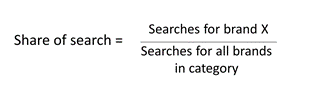
What is 'Share of Search'?
Les Binet is a leading thinker within the marketing industry and has shaped many views over the last decade.
To summarise the Share of Search proposition, an increase in share of organic search measured on Google trends reflects market share increases. Binet acknowledges it is not perfect and more a ‘fast and cheap predictive metric’ to support brand and market measurement.
Share of Search is underpinned by 10 significant findings:
- Share of Search correlates with market share.
- Share of Search is a leading indicator / predictor of Share of Market – when Share of Search goes up, Share of Market tends to go up too and when Share of Search goes down, Share of Market falls. The gap between them – the Extra Share of Search (ESOS) – is a particularly solid indicator of market share movements.
- The lead time for Share of Search on Share of Market can be substantial.
- This long-term prediction can also act as an early warning system for brands, in terms of their market share.
- Share of Search is not a perfect predictor though, as conversion is of course affected by other factors, particularly price. Equally, not all search activity is positive.
- Share of Voice (advertising) has two effects on Share of Search: a big short-term effect that dies away quickly - as well as a smaller, longer-term effect that decays away slowly.
- The long-term effects, however, accumulate over time.
- Sustained advertising drives the growth of Share of Search - with 60% of searches coming from the long-term effects and 40% from short-term effects.
- Each brand has an equilibrium level: if the Share of Voice falls below the equilibrium level, the Share of Search tends to fall over the next two years; if the Share of Voice is above equilibrium, the Share of Search tends to rise over the next two years.
- Share of Search could also be a new measure for brand strength and health by measuring the base level of Share of Search without advertising.
Google Trends limitations:
A big area of debate around the Share of Search methodology is regarding the data set used. Whilst universally accessible, we know that Google search trend data is not actual searches. SEO and PPC tactics can greatly affect the ability for a brand to ‘win in search’, however, the most recent updates to Share of Search methodology acknowledge this point.
For many brands, the problem in using Google Trends is that they simply are not big enough to feature – there is not enough data, or rather, not enough brand interest.
Big brands are big for a reason:
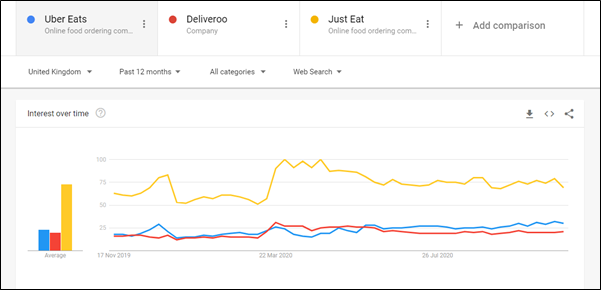
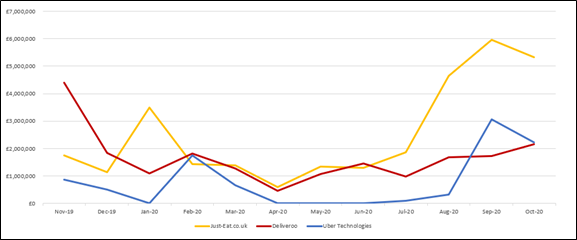
Using relevant brand examples, we can see that search interest for Just Eat indexes is higher in comparison to competitors in Google Trends. Using Nielsen data, we can also see that Just Eats’ investment in above the line (ATL) has been greater over the same period. This suggests a strong correlation between share of search and share of market success, using Binet’s research on Google Trends.
Google Trends:
Nielsen:
Solutions for brands that do not appear on Google Trends
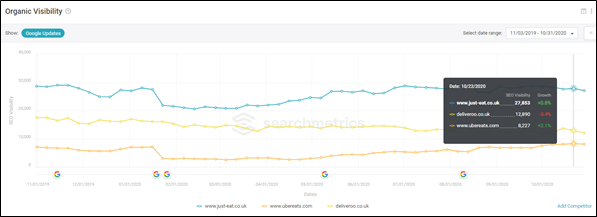
Binet also recognises that ‘Google Trends data should always be considered as one data point among others before drawing conclusions.’ As part of our research, we used Searchmetrics data to track organic search visibility (showing that Just Eat are also leading here) - an indication of how visible a website is based on an amalgamation of metrics, as opposed to actual visits. Whilst visibility is not a performance metric and should be used as guidance and confirmation, it highlights the need for brands of all sizes to be able to measure outcomes.
Searchmetrics:
Using SimilarWeb to measure outcomes:
The most relevant, encompassing, and useful insight comes from SimilarWeb. Insight highlights that Just Eat are turning search interest and intent into website visits and app usage and ultimately, market share and revenue, through an integrated strategy.
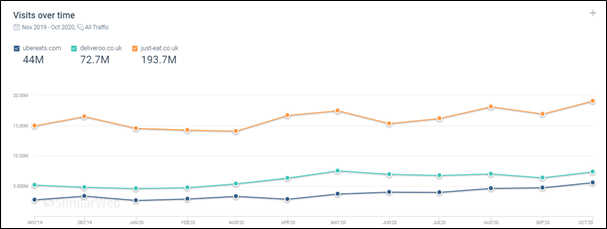
They are also maintaining share of visits through their paid and organic search tactics and, whilst not shown, are able to benchmark softer metrics such as time on site and pages per visit. Interestingly, for this category, having more time on site may not be deemed as a success.
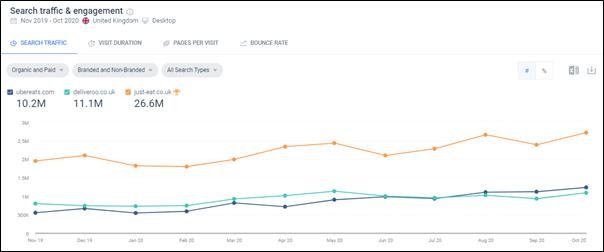
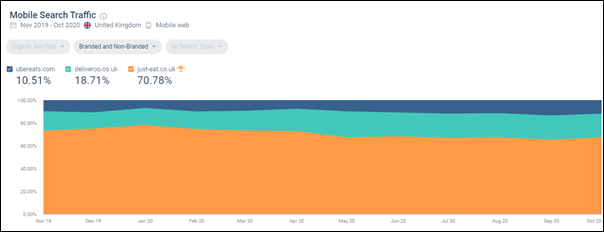
Importantly for this category and demographic we can use SimilarWeb to analyse keywords by source and device to see opportunity.
And in-app average monthly users:
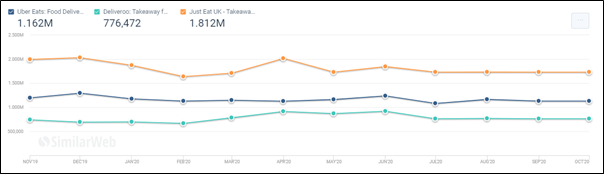
SimilarWeb provides website and app data for a far broader range of brands, regardless of whether they appear on Google Trends or not. It allows us to report on category performance (bespoke and suggested) and we now use the API to report on ‘Share of Visits’ when determining the best approach – tactically and strategically. Every client now can measure their performance against their competitors!
Understanding the messy middle - How we use SimilarWeb for all clients:
The ability for a brand to translate search interest into visits and sales is not easy. Google’s recent work on customer journeys introduces the concept of ‘the messy middle’ to highlight how easy it is for a brand to lose track of customers along the purchase funnel.
At 26, using SimilarWeb as one significant ‘data point amongst others’, we are able to take a ‘full funnel’ approach to clients marketing to help plan and measure integrated campaigns.
Importantly, the use of available tools (especially SimilarWeb) allows us to support Binet’s research into Share of Search as an incredibly easy to use metric for brands that are big enough to feature on Google Trends.
In summary, the below table identifies the market share for Just Eat in each stage of the customer journey and helps identify potential areas to address to ensure maximum efficiency, in what is an incredibly fast moving and competitive market.
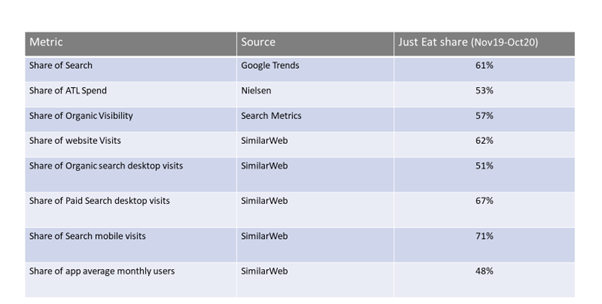
*Google trends is a snapshot rather than average over time.
Our insights
Tap into our latest thinking to discover the newest trends, innovations, and opinions direct from our team.